Master the Donchian Flag Strategy for NinjaTrader 8

Introduction: Build Your Customizable Trading System
Traders often struggle to identify reliable trade setups and manage risk effectively. The Donchian Flag Pole Setup indicator is a highly configurable tool with multiple adjustable parameters, allowing traders to fine-tune their strategies. It simplifies the process by automatically detecting high-probability flag setups and is easy to integrate into trading systems since all the complex logic is handled within the indicator itself.
This article focuses on using the Donchian Flag Pole Setup (documentation: here), a standalone tool for detecting high-probability flag setups. While this setup provides a strong foundation, traders can further enhance their strategies by integrating additional indicators, including TradingDJ, standard NinjaTrader indicators, and other custom indicators. We will explore how to create two breakout trading strategies with different stop-loss techniques, both available on GitHub.
🔄 Update – April 2025
The Donchian Flag Pole Setup indicator has been updated in the TradingDJ Indicators Bundle version 1.0.0.13, introducing two new required parameters:
LoadExtremeBreakImpulseExtremeBreak
These control how extreme bar breaks are handled during the load phase and impulse detection, adding more precision to your setup logic.
⚠️ If you're using a previous strategy or script, you must update your code to include these parameters.
- You can either pass
falsefor both (to preserve old behavior), - Or explore new logic by enabling them with
true.
The strategy examples in this post have been updated accordingly, and we recommend re-importing the latest version of the bundle to avoid compatibility issues.
Understanding Flag Patterns in Trading
A flag pattern is a technical formation that signals a potential continuation of the prevailing trend. It consists of two key components:
- Flagpole: A strong price movement in one direction (upward or downward) that forms the initial trend.
- Flag: A consolidation phase where price moves within a small range, often forming a rectangular or channel-like shape before breaking out in the direction of the original trend.
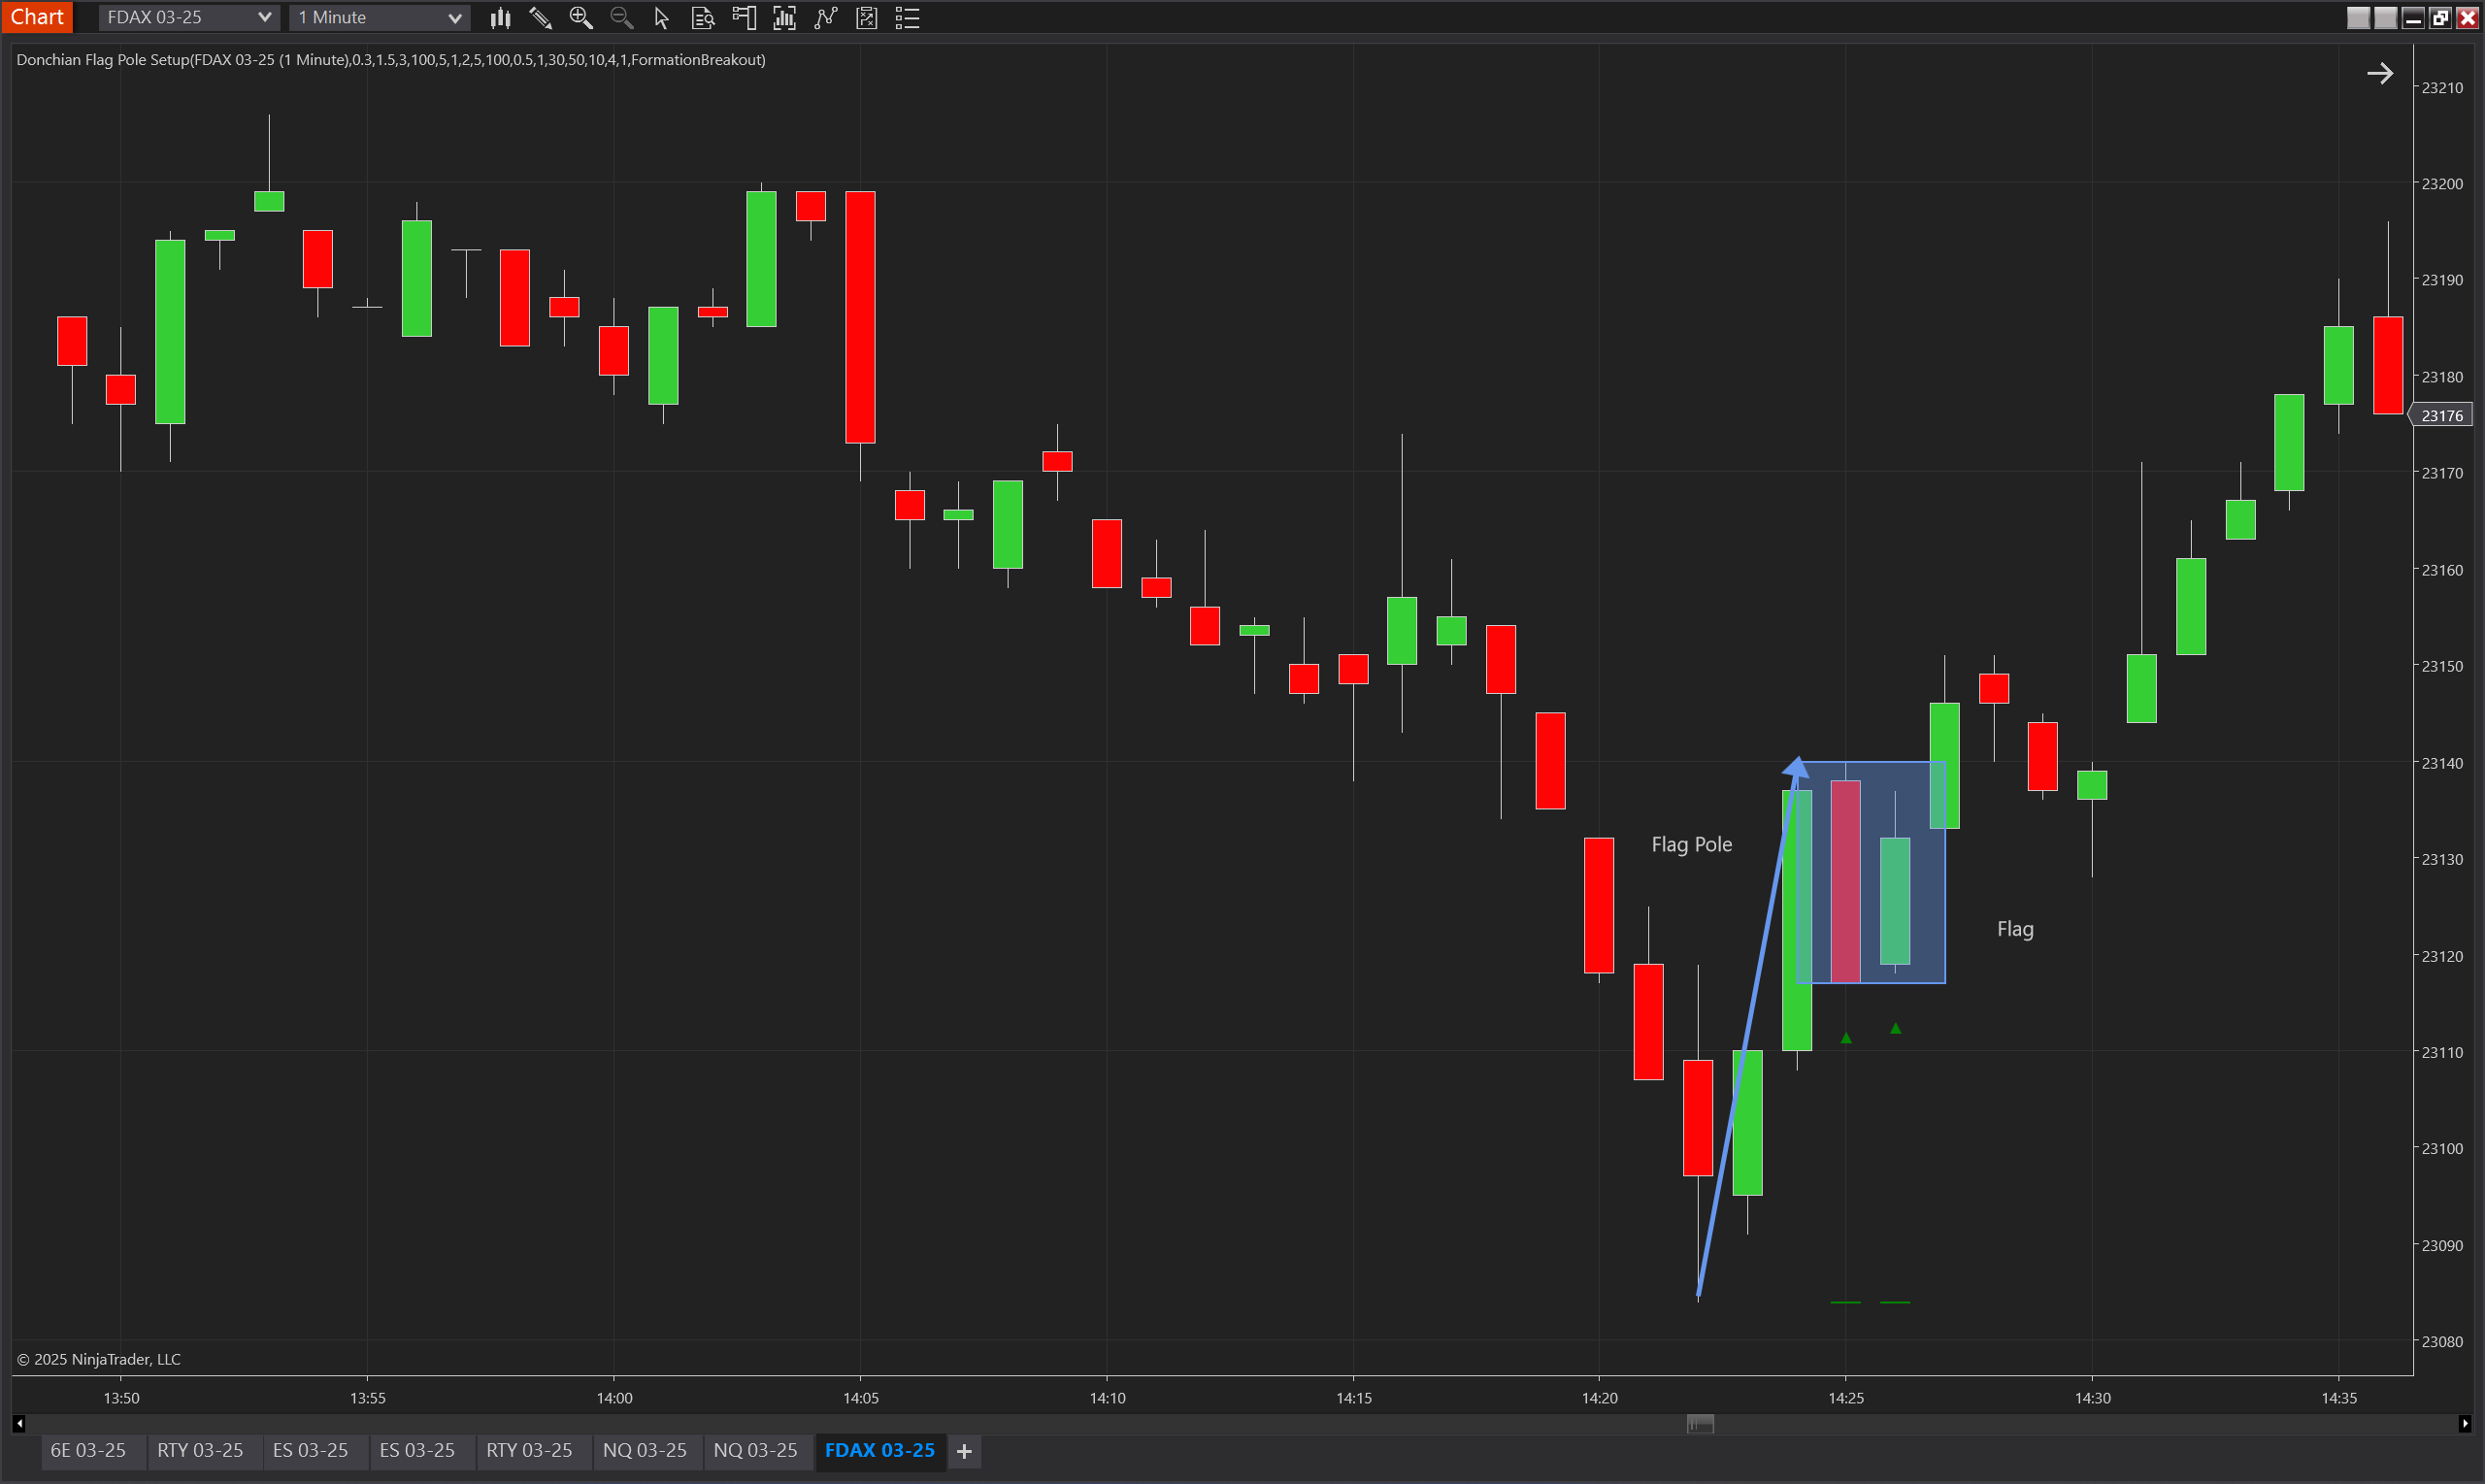
Traders use flag patterns to identify opportunities where a breakout from the consolidation zone could lead to a strong continuation move.
What the Donchian Flag Pole Setup Does
The Donchian Flag Pole Setup indicator identifies flag formations based on the impulse phase of a trend, using customizable rules to measure momentum based on the bar bodies or closes. Key features include:
- Starting Point: Defines the flagpole’s start using the Donchian channel (lower channel for up flags, upper channel for down flags). By adjusting the Donchian channel period, traders can control the frequency of setups: a low period captures more setups, while a higher period (e.g., 20 or 50) ensures flags are taken only when significant levels are touched.
- Customizable Length: Defines flagpole extension using ATR multiples or average multiples.
- Flexible Application: Can be used for trend continuation or mean reversion setups.
- Trade Setup Automation: Provides clear trade setups without requiring additional indicators. However, traders can refine their approach by using other indicators as filters or applying discretion based on the overall market context. This flexibility allows for better confirmation and adaptation to different trading styles.
With this setup, traders can focus on execution while maintaining the flexibility to adapt to market condition
Integrating and Customizing the Strategy
It is recommended that you create a copy of this strategy in another folder to avoid losing custom modifications when future updates are released. To keep track of your personalized adjustments, you can rename it with your initials instead of TdjLab.
To integrate this strategy, you can clone the repository from GitHub: GitHub Repository
Or, you can import the strategy directly into NinjaTrader:
Download the ZIP files:
- Import via
Tools > Import > NinjaScript Add-On
Breaking Down the Code Integration
1. Initializing the Donchian Flag Pole Setup Indicator
The core of this strategy is integrating the Donchian Flag Pole Setup indicator, which is instantiated with the following parameters:
private TdjDonchianFlagPoleSetup flagPoleSetup;

flagPoleSetup = TdjDonchianFlagPoleSetup(DonchianChannelPeriod, LoadPeriod, LoadExtremeBreak, BodyAveragePeriod, PoleMinBars, PoleMaxBars, AverageBodySizeRatio, ExtensionSizeMinATRMultiples, AverageBarExtensionATRMultiples, MinAverageCloseRatio, SetupType, MinPullbackBars, MaxPullbackBars, ComparisonDCPeriod, PoleDCRangeMinPercentage, PoleDCRangeMaxPercentage, MinPullbackPercentage, MaxPullbackPercentage, ImpulseExtremeBreak);
2. Configuring the Indicator Parameters
These default values define how the flagpole setup is detected and adjusted based on price action. However, you can modify them to better fit your trading style and market conditions. Below are the key parameters used in the strategy:
- Donchian Channel Period: Number of periods used to calculate the Donchian Channel.
- Load Period: Number of bars considered for the load phase.
- Body Average Period: Number of bars considered for the average body size calculation.
- Pole Min Bars: Minimum number of bars required in the flag pole.
- Pole Max Bars: Maximum number of bars allowed in the flag pole.
- Average Body Size Ratio: Determines the ratio of the average body size in relation to the setup.
- Extension Size Min ATR Multiples: The minimum size of the extension in the direction of the flag pole, measured in ATR multiples.
- Average Bar Extension ATR Multiples: The average bar extension of the flag, measured in ATR multiples.
- Min Average Close Ratio: The minimum average close ratio of the bars forming the pole in the direction of the flag pole.
- Setup Type: Defines the type of flag pole setup being used.
- Min & Max Pullback Bars: Defines the minimum and maximum bars in a pullback formation.
- Comparison DC Period: The number of periods used for the comparison Donchian Channel.
- Pole DC Range Min & Max Percentage: The percentage range of the flag pole relative to the Donchian Channel range.
- Min & Max Pullback Percentage: Defines the minimum and maximum pullback percentage relative to the range.
These values define how the flagpole setup is detected and adjusted based on price action, and traders can fine-tune them for better optimization.
DonchianChannelPeriod = 5;
LoadPeriod = 2;
BodyAveragePeriod = 3;
PoleMinBars = 1;
PoleMaxBars = 4;
AverageBodySizeRatio = 1.5;
ExtensionSizeMinATRMultiples = 1;
AverageBarExtensionATRMultiples = 0.3;
MinAverageCloseRatio = 0.5;
SetupType = TdjDonchianFlagPoleSetupProperties.SetupType.FormationBreakout;
MinPullbackBars = 1;
MaxPullbackBars = 5;
ComparisonDCPeriod = 100;
PoleDCRangeMinPercentage = 10;
PoleDCRangeMaxPercentage = 50;
MinPullbackPercentage = 30;
MaxPullbackPercentage = 100;
3. Implementing the Entry Logic
The strategy enters trades based on the flag setup signals:
if (flagPoleSetup.SignalUp[0]) {
    EnterLongStopMarket(Convert.ToInt32(DefaultQuantity), flagPoleSetup.SignalUpUpperLevel[0] + 1 * TickSize, "EntryLong");
}

if (flagPoleSetup.SignalDown[0]) {
    EnterShortStopMarket(Convert.ToInt32(DefaultQuantity), flagPoleSetup.SignalDownLowerLevel[0] - 1 * TickSize, "EntryShort");
}
This logic ensures that:
- A long trade is triggered when a valid bullish flag pattern is detected.
- A short trade is triggered when a valid bearish flag pattern is detected.
Encouraging Traders to Backtest and Customize
Now that you've seen how this strategy is structured, it's essential to backtest and refine it based on your trading preferences.
- Test different parameter settings to see how they impact performance.
- Experiment with additional filters, such as volume indicators, trend confirmation tools, or an indicator from the TradingDJ bundle like Bias Indicators or Trend Indicators (view TradingDJ indicators).
- Run historical backtests and forward-test in simulated environments before deploying live.
Optimizing the Strategy
To refine the strategy, traders can optimize various parameters, particularly those affecting trade entry and risk management. Below, we will walk through an example of optimizing the Close at Bar parameter.
1. Opening the Strategy Analyzer
- In NinjaTrader 8, go to
Control Center > New > Strategy Analyzer. - Select the Donchian Flag Range Breakout V2 strategy.
- Choose an instrument and time period for the backtest.
2. Optimizing Key Parameters
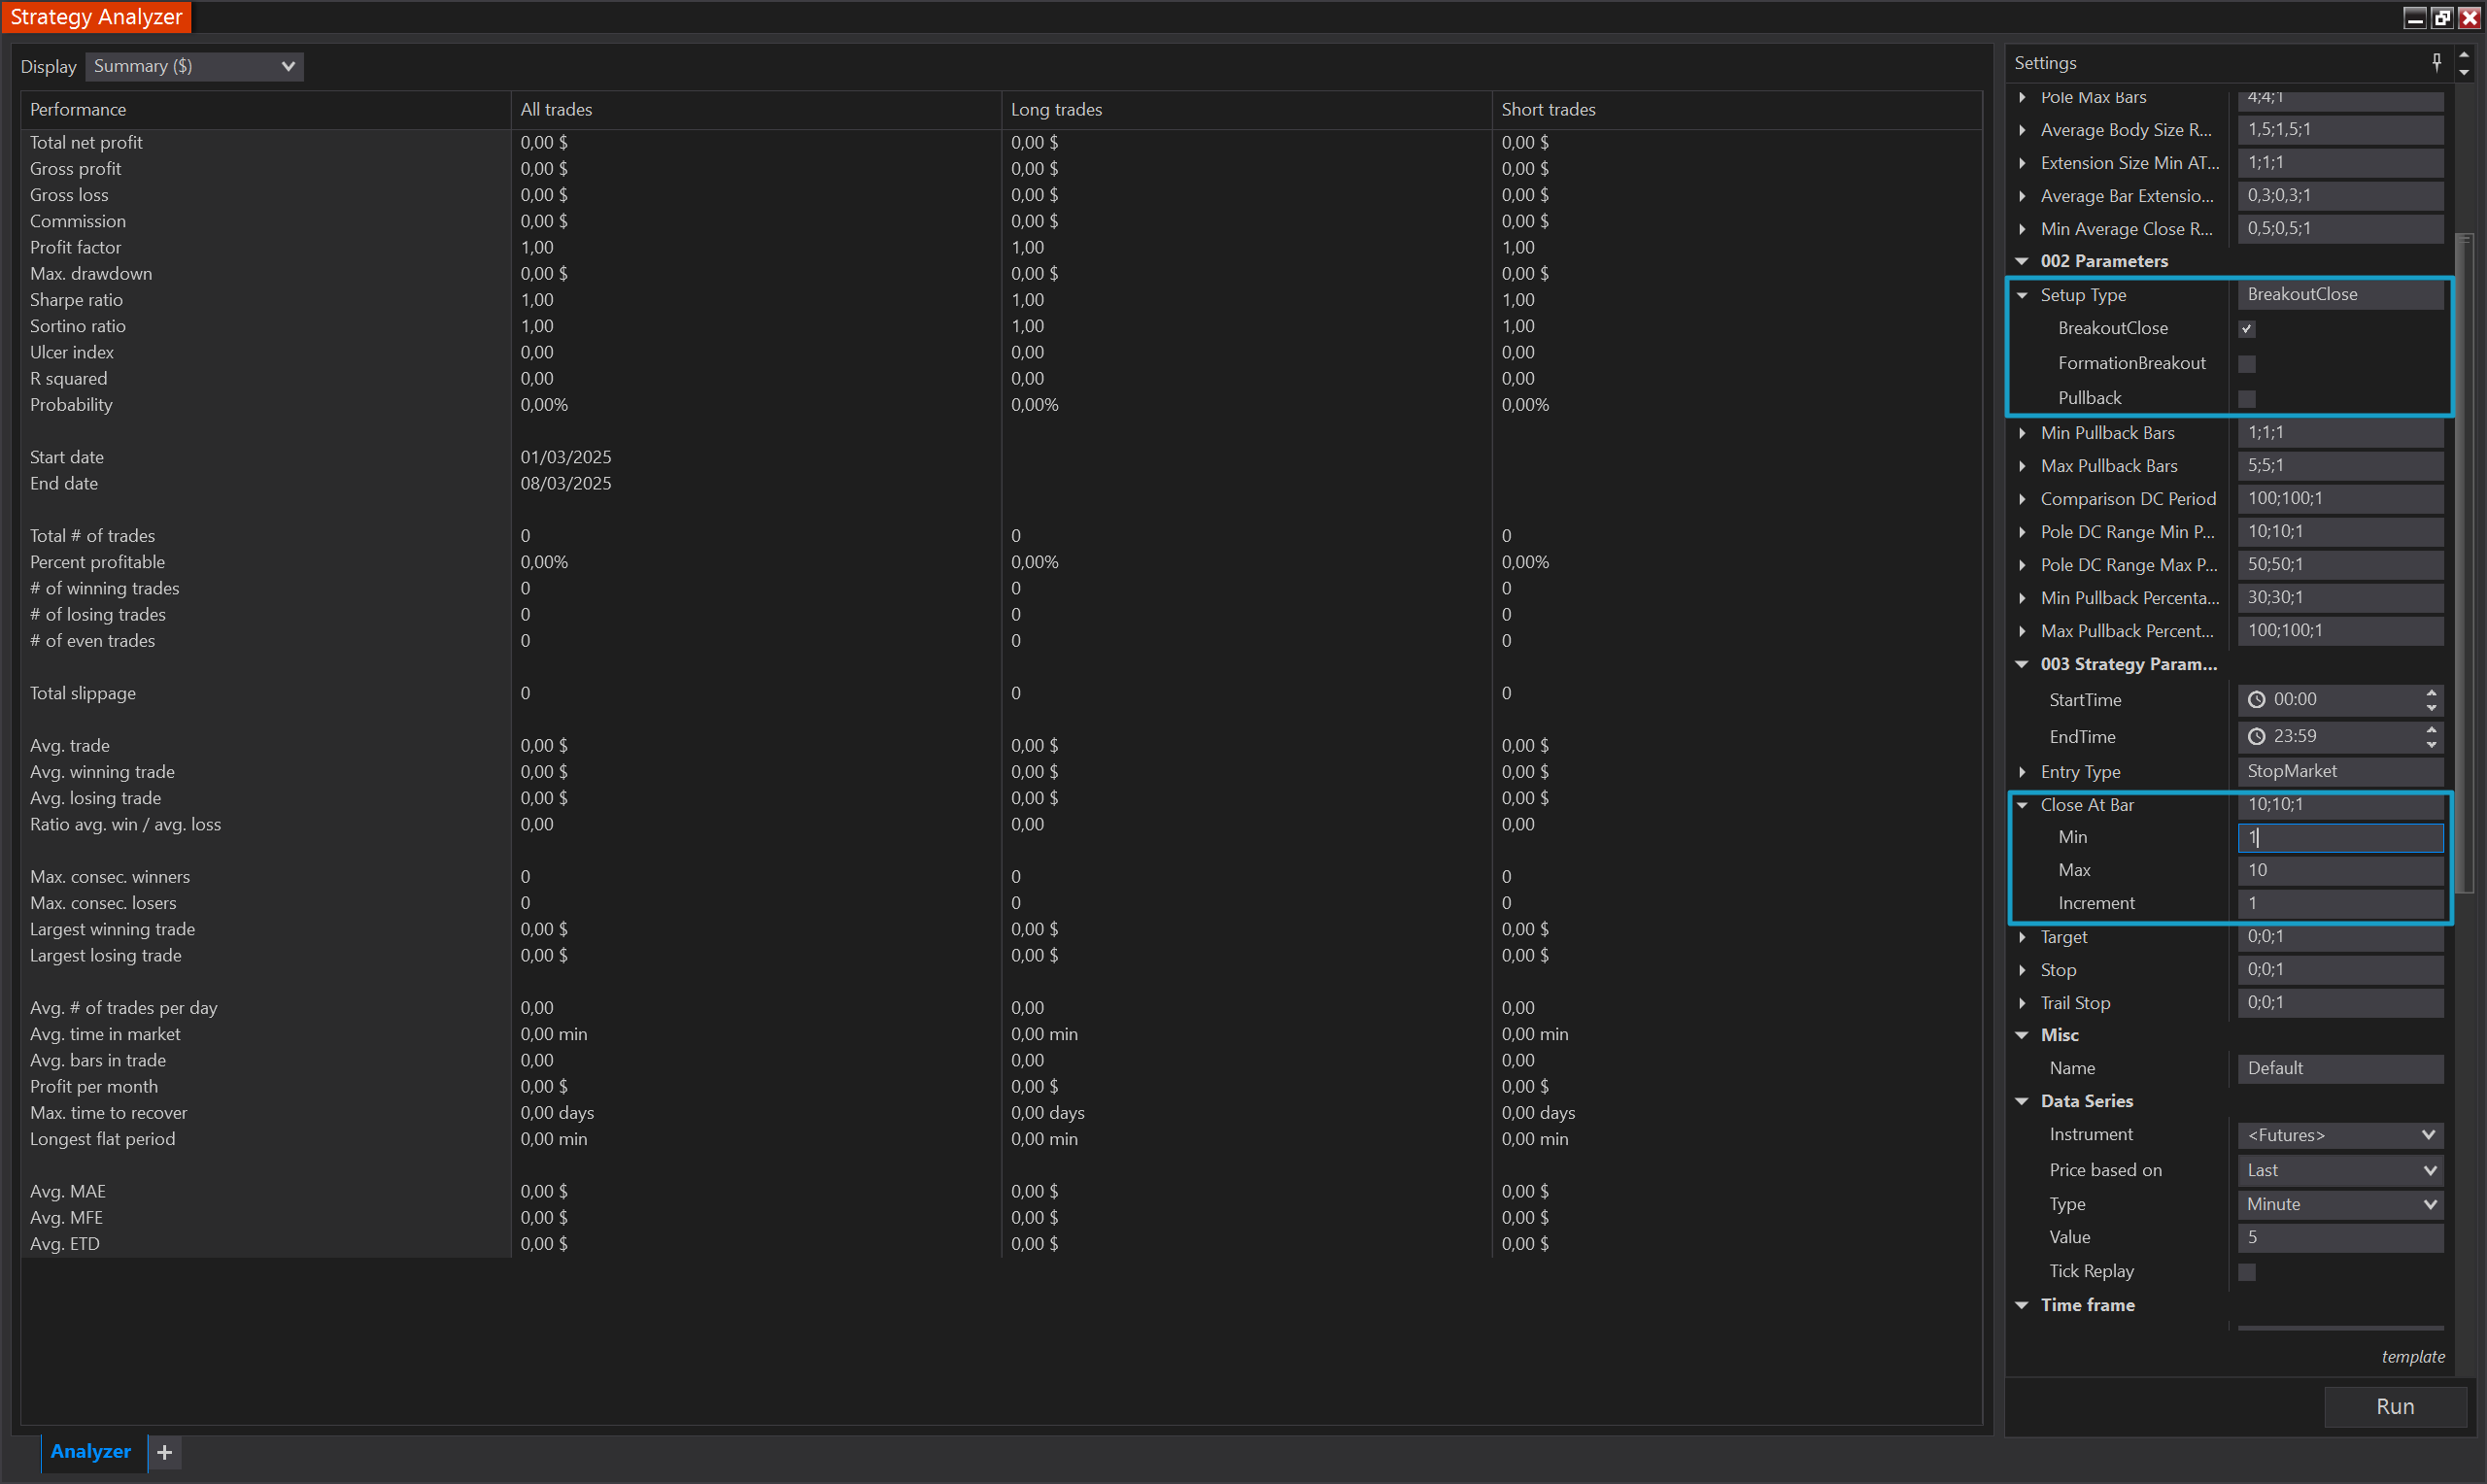
For this test, we focused on optimizing the Close at Bar parameter to analyze how many bars it takes for the setup to play out. The Setup Type was not optimized; we simply selected BreakoutClose as the fixed setup type.
- Setup Type: BreakoutClose
- Close at Bar (Min: 1, Max: 10, Increment: 1)
By adjusting this parameter, we can determine the optimal number of bars for trade exits based on backtest results.
3. Reviewing Backtest Results
The first image shows the initial strategy settings before optimization:
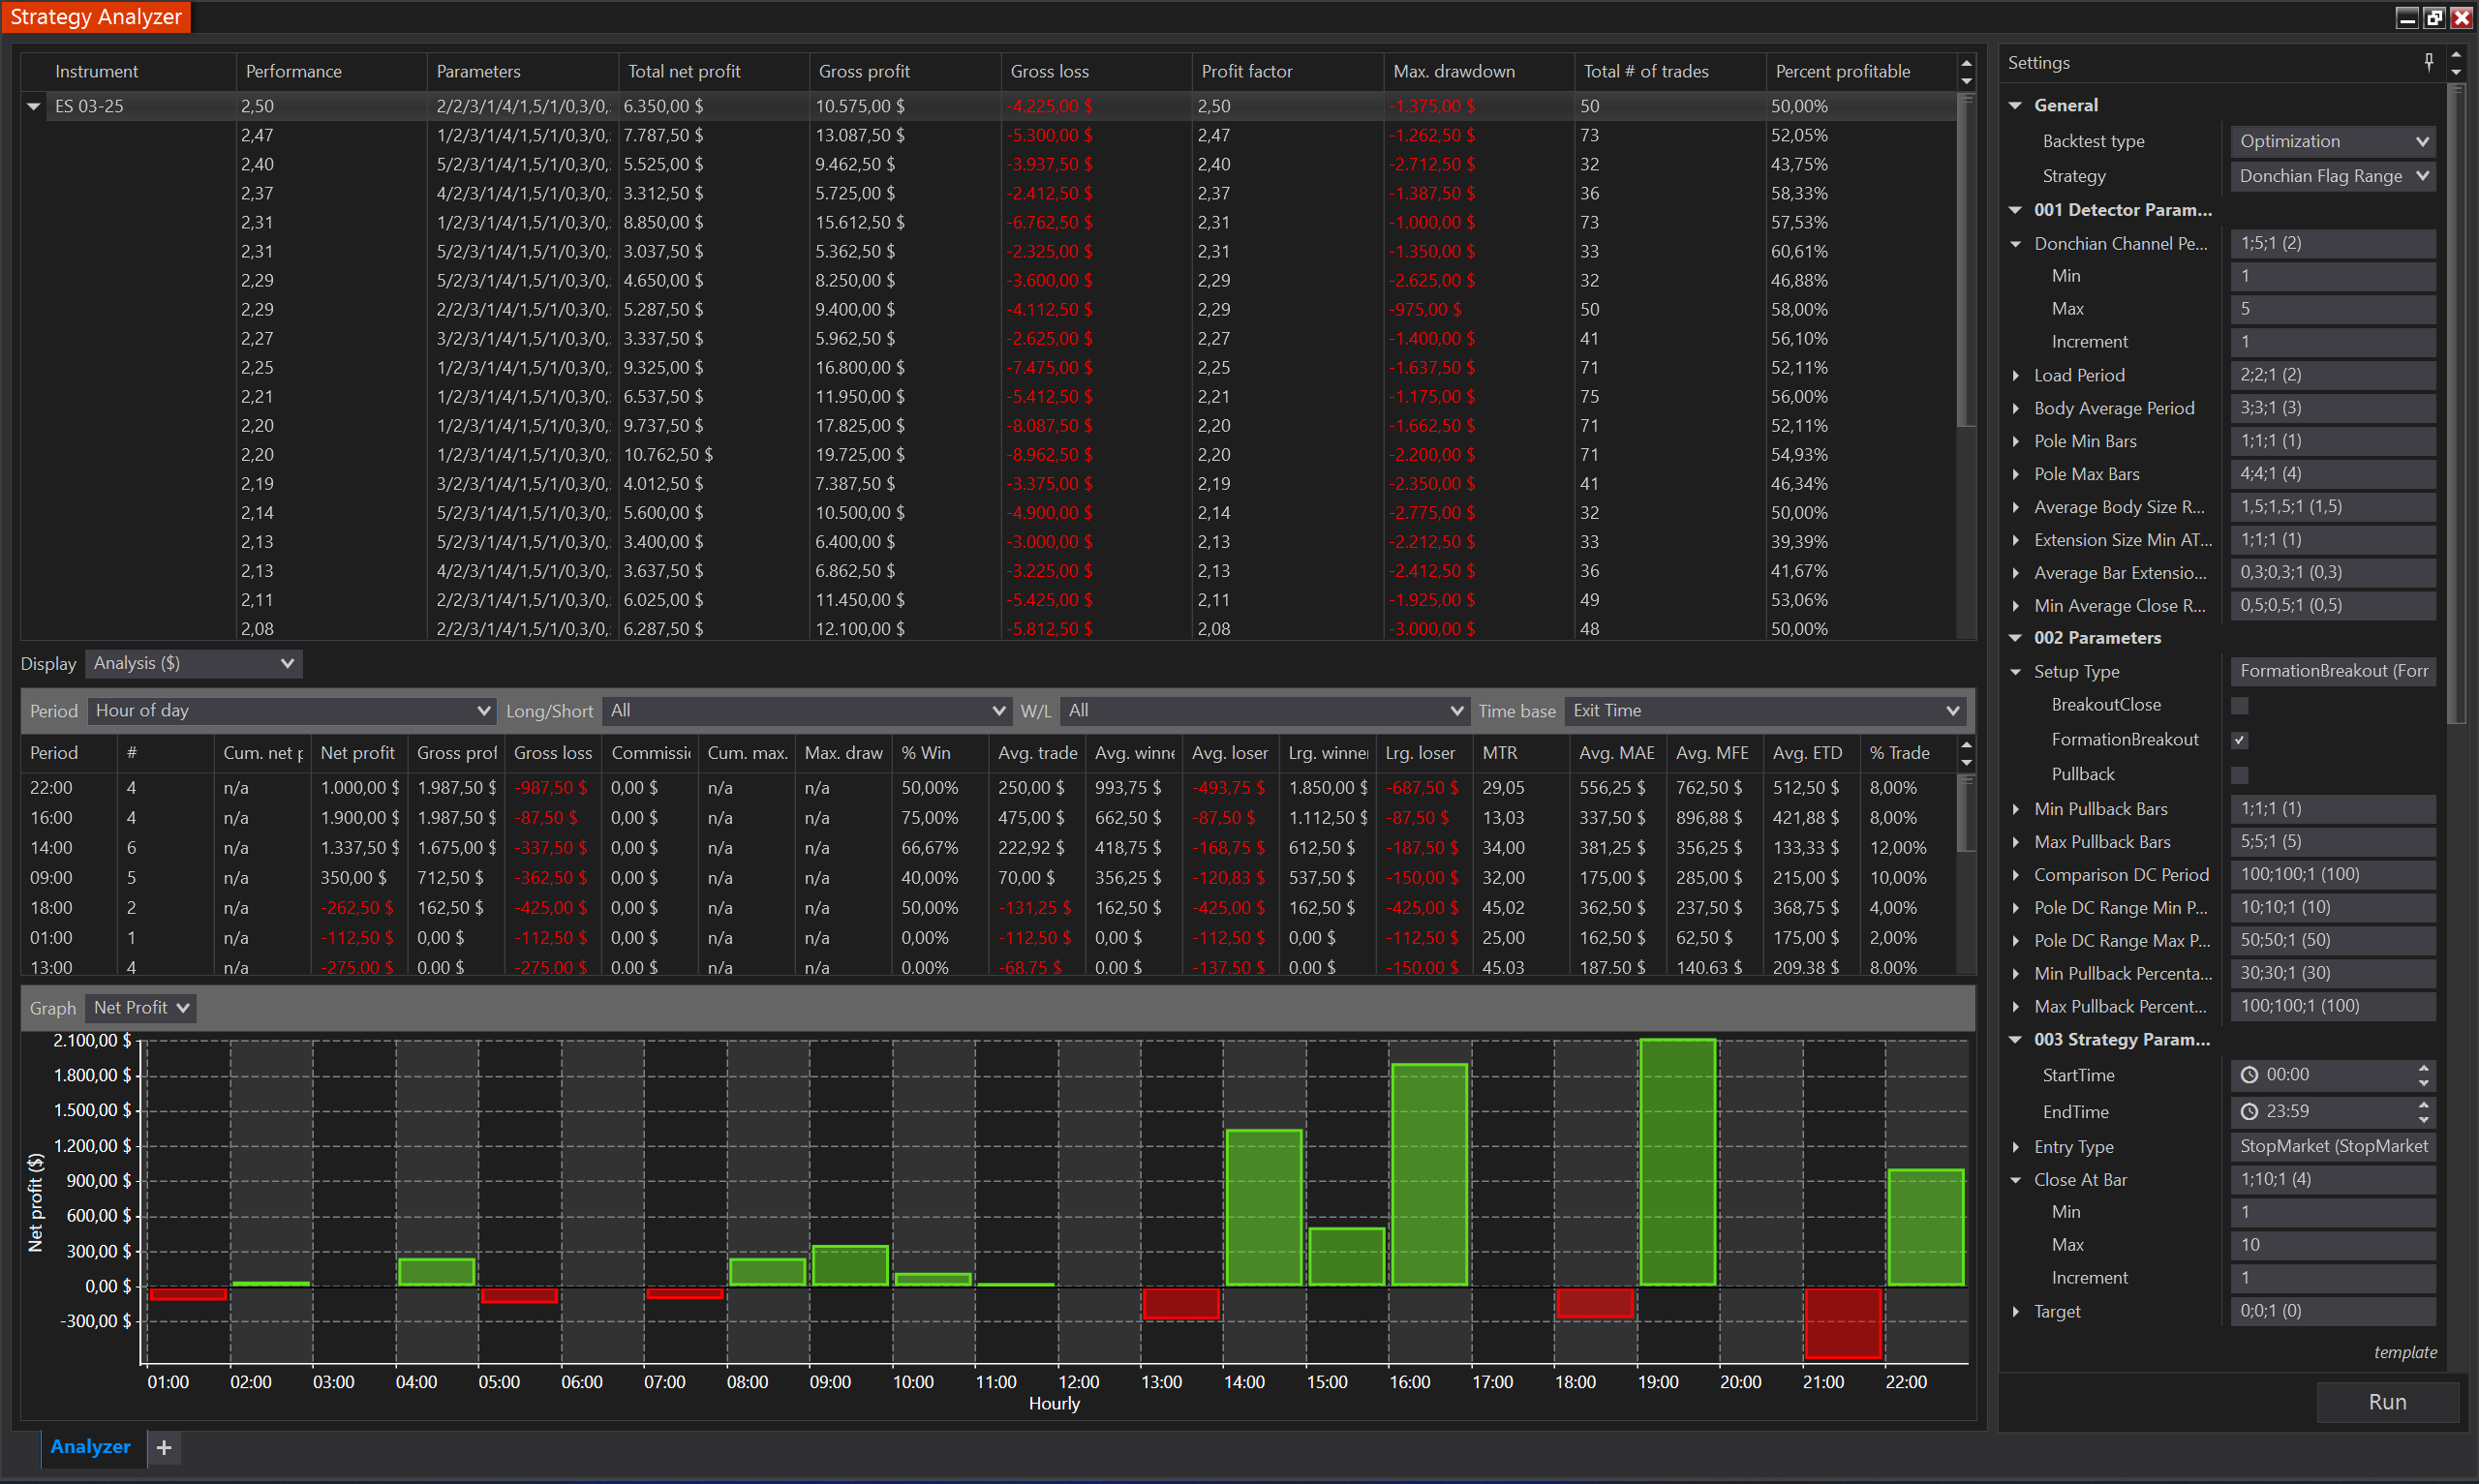
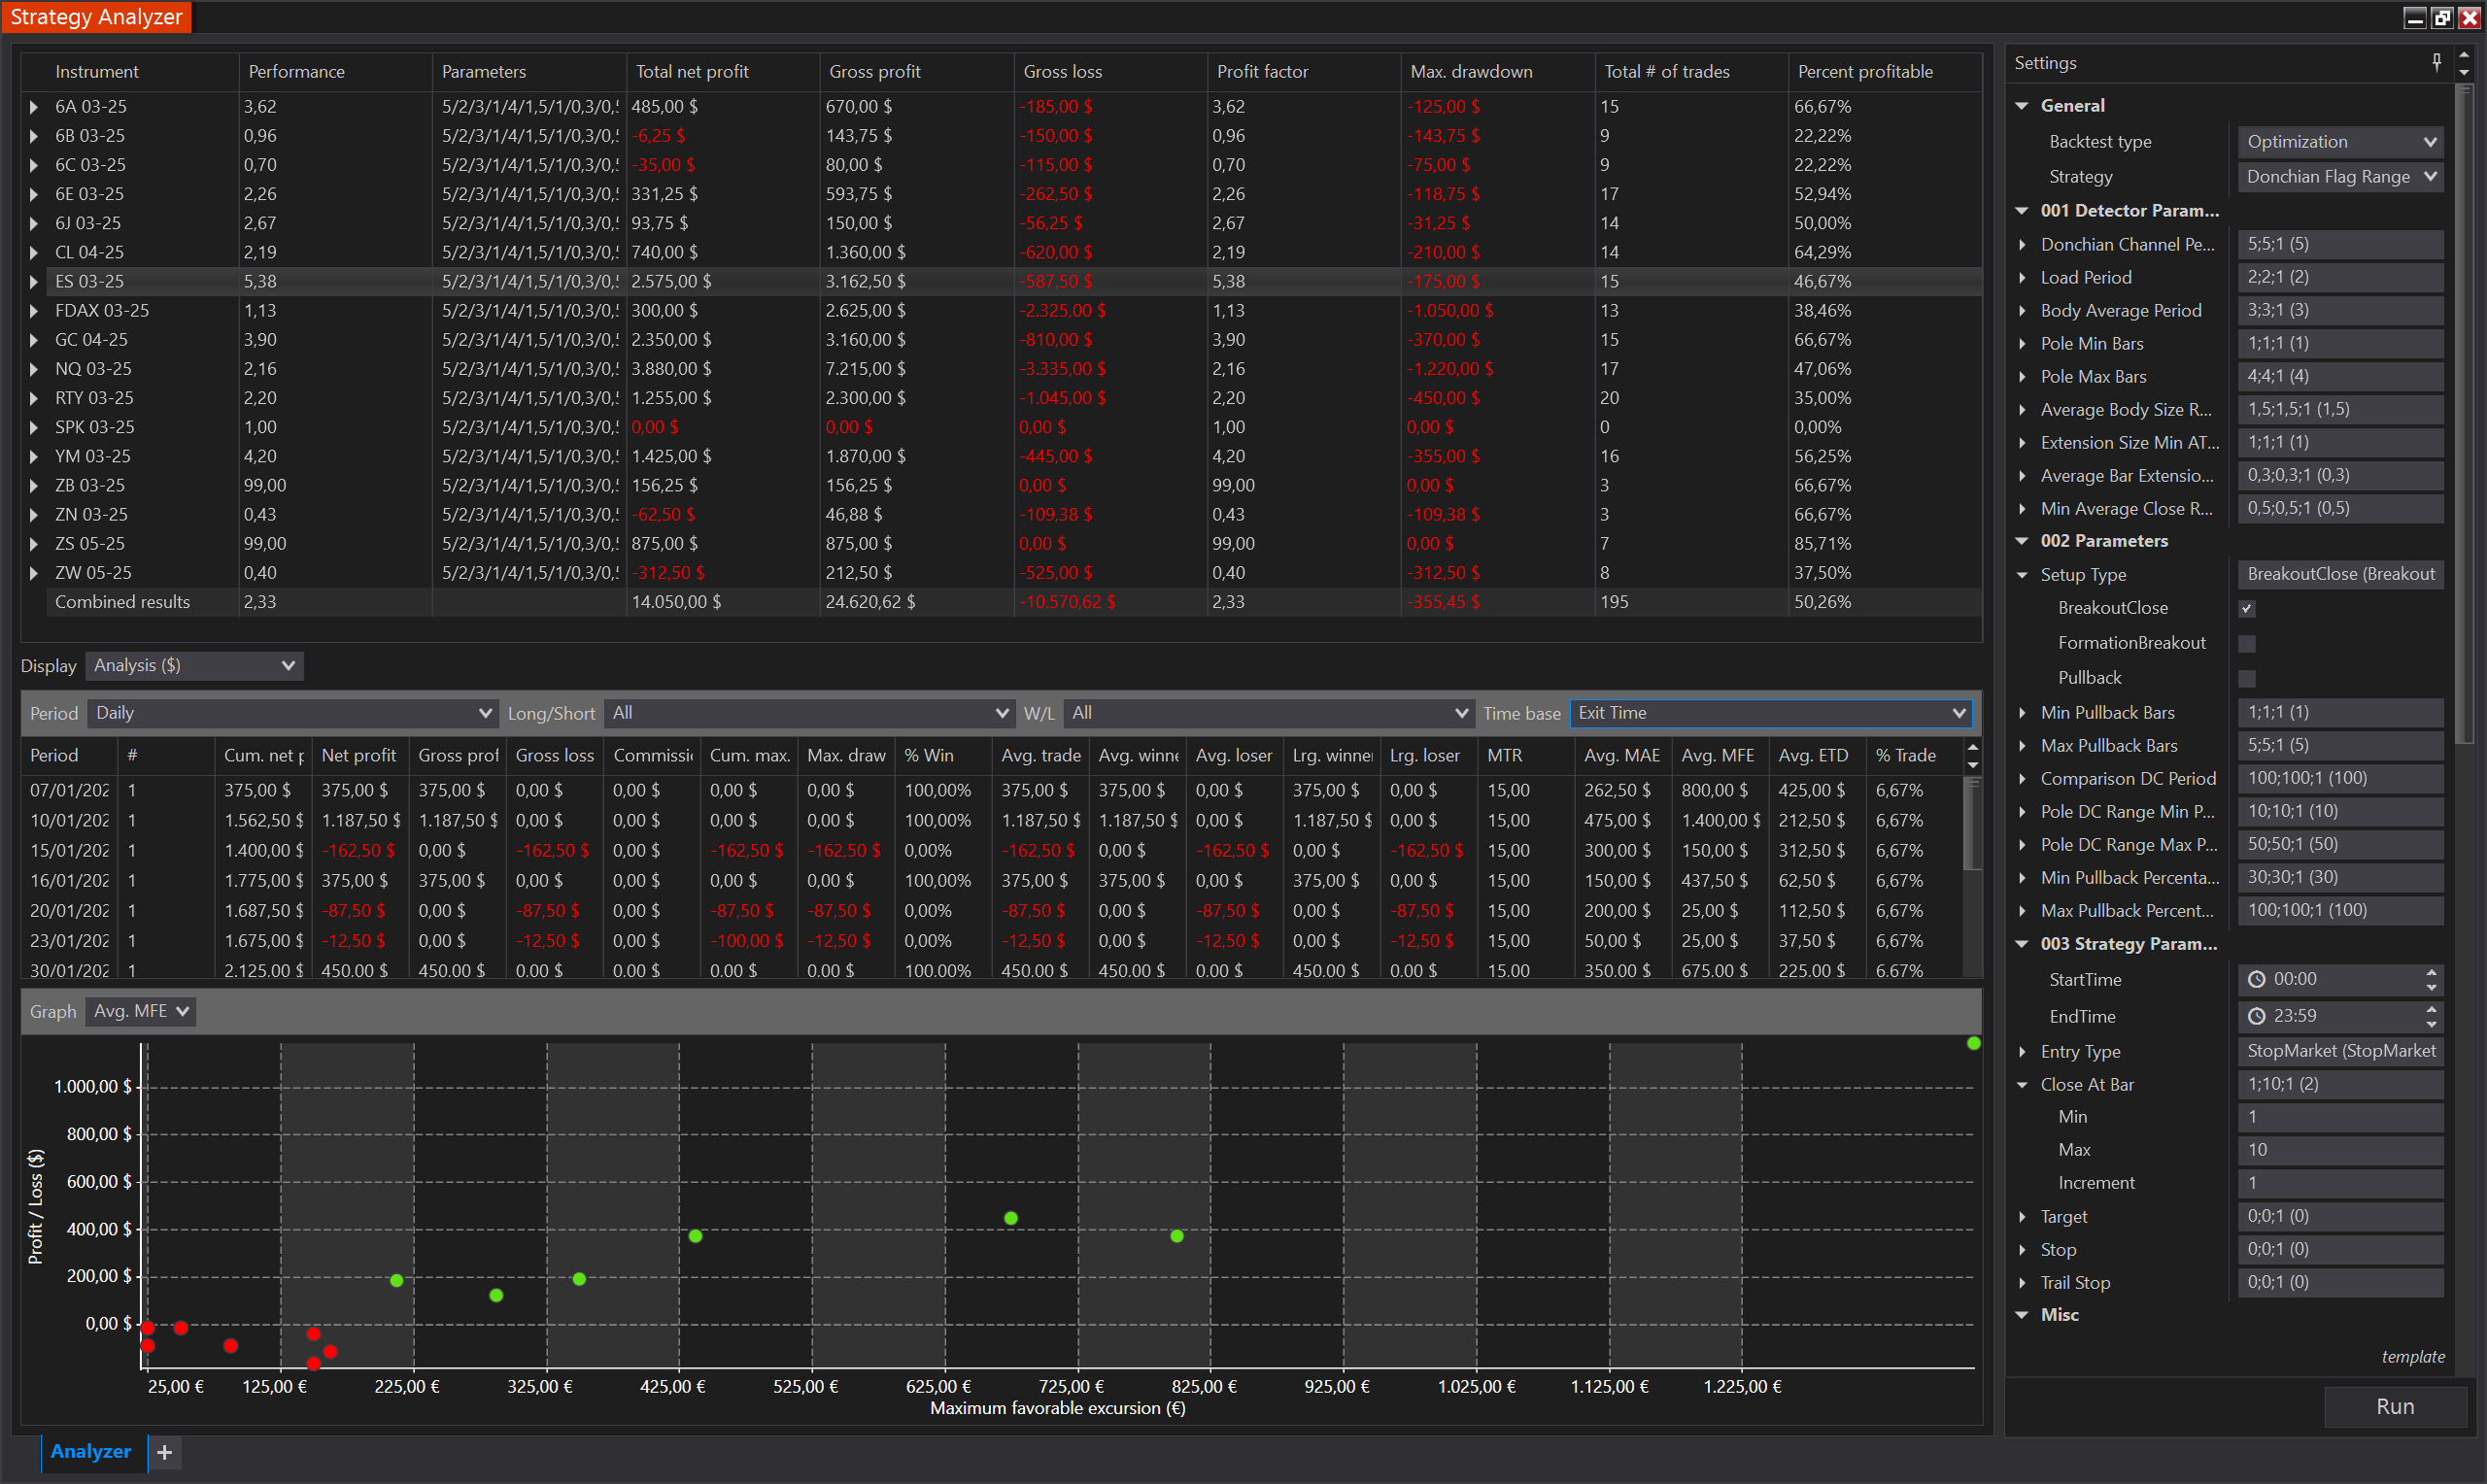
The second image displays the results after optimization, where performance metrics such as net profit, drawdown, and trade frequency can be analyzed.
Encouraging Traders to Backtest and Customize
Now that you've seen how this strategy can be optimized, it's essential to backtest and refine it based on your trading preferences.
- Test different parameter settings to see how they impact performance.
- Experiment with additional filters, such as volume indicators, trend confirmation tools, or an indicator from the TradingDJ bundle like Bias Indicators or Trend Indicators (view TradingDJ indicators).
- Run historical backtests and forward-test in simulated environments before deploying live.
Conclusion: Build and Optimize Your Strategy
The Donchian Flag Pole Setup is a versatile tool that can be integrated into automated trading strategies. By following the step-by-step breakdown, traders can:
- Understand how the strategy works at a code level.
- Implement and modify key parameters to suit their risk tolerance.
- Optimize both strategy versions to improve performance and determine the best configuration for different market conditions.
Next Steps:
- Download the TradingDJ Indicators Bundle (Google Drive Link).
- Clone or import the strategy and start backtesting.
- Experiment with filters, optimizations, and additional indicators to refine your trading edge and enhance strategy performance.