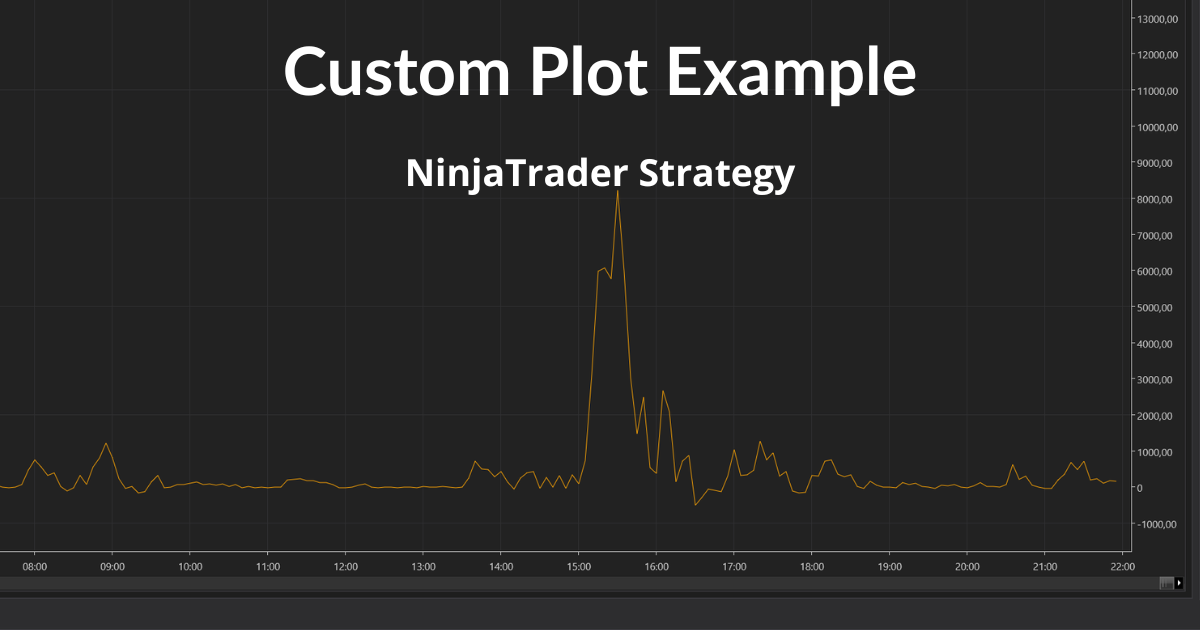
How to Add a Custom Plot to Your NinjaTrader Strategy (Step-by-Step)
Learn how to add a custom plot to your NinjaTrader 8 strategy using either the Strategy Builder or manual code. Visualize internal values like moving average slopes or momentum scores during playback.

When developing a NinjaTrader strategy, sometimes you need to see inside the logic — especially when you're calculating values that influence your entries or exits.
Instead of guessing whether your custom formula is working, why not plot it directly on the chart?
In this guide, you’ll learn how to add a custom plot to your strategy so you can observe internal calculations during playback or live simulation.
Why Plot Internal Values?
You might be combining moving averages, detecting momentum, or calculating some risk-adjusted value. Plotting helps you:
- Visualize how your logic behaves over time
- Spot bugs and edge cases
- Tune your thresholds or exit points
- Build trust in your system before using real money
Let’s walk through a simple example using a metric we’ll call MomentumBias.
What the Plot Will Show
In this example, we’ll calculate MomentumBias using two elements:
The slope of a short-term moving average
The distance between the current close and a longer-term average
These two components together help describe short-term trend pressure and directional strength. Plotting the result gives you insight into how it behaves in different market conditions.
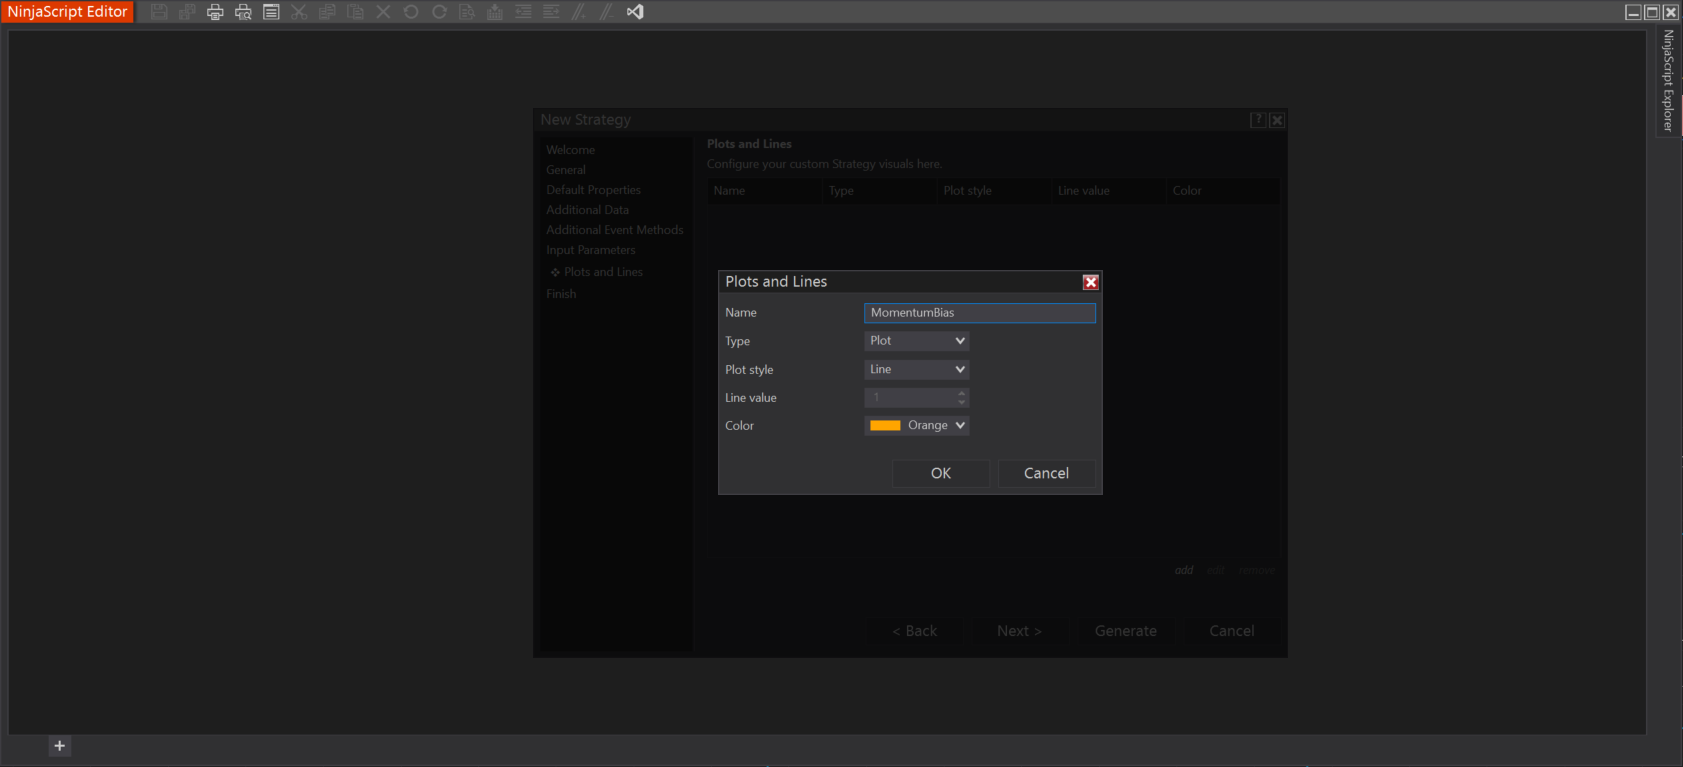
Step 1: Use the Strategy Wizard (Optional)
If you create your strategy using the Strategy Creation Wizard, NinjaTrader will automatically insert the plot for you.
Just go to:
New Strategy → Plots and Lines → Add
Set the following:
Name: MomentumBias
Type: Plot
Plot Style: Line
Color: Orange (or any visible color)
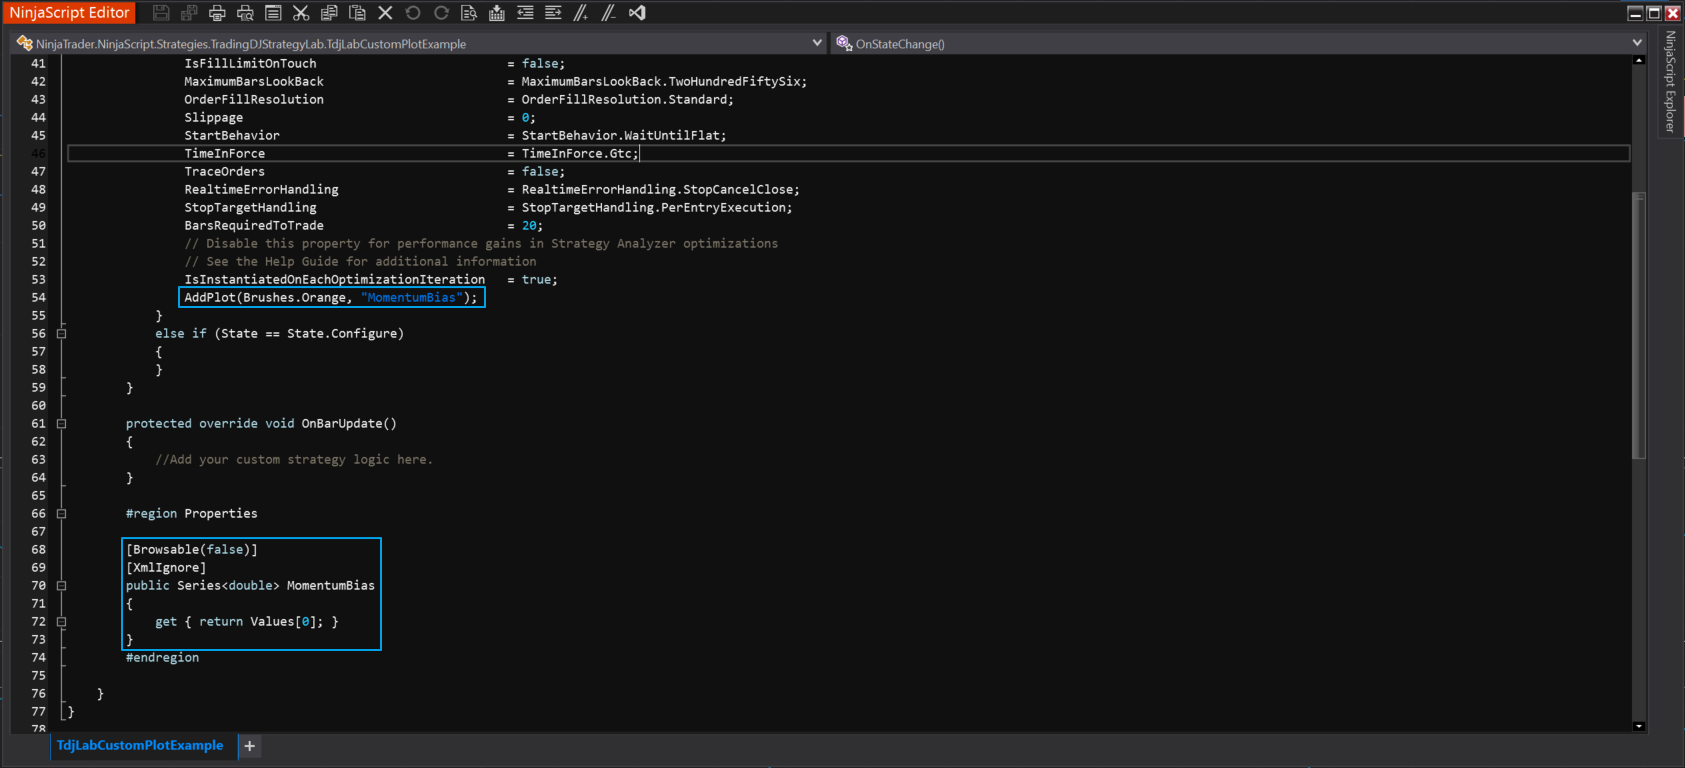
Once you click OK, NinjaTrader will generate this lines in your code:
AddPlot(Brushes.Orange, "MomentumBias");

[Browsable(false)]
[XmlIgnore]
public Series<double> MomentumBias
{
    get { return Values[0]; }
}
Step 2: Add the Plot Manually in Code (if needed)
If you're writing the strategy directly or want to add another plot later, just insert this inside OnStateChange() under State.SetDefaults:
AddPlot(Brushes.Orange, "MomentumBias");Then, expose it with a property like this:
[Browsable(false)]
[XmlIgnore]
public Series<double> MomentumBias
{
    get { return Values[0]; }
}
Step 3: Assign Values in OnBarUpdate
Now you’re ready to feed data into your plot.
Here’s an example that calculates a simple momentum bias:
protected override void OnBarUpdate()
{
    if (CurrentBar < 20)
        return;

    double shortMA = SMA(Close, 5)[0];
    double longMA = SMA(Close, 20)[0];
    double slope = shortMA - SMA(Close, 5)[1];
    double distance = Close[0] - longMA;

    MomentumBias[0] = slope * distance;
}
This calculated value will appear as a line in the chart panel.
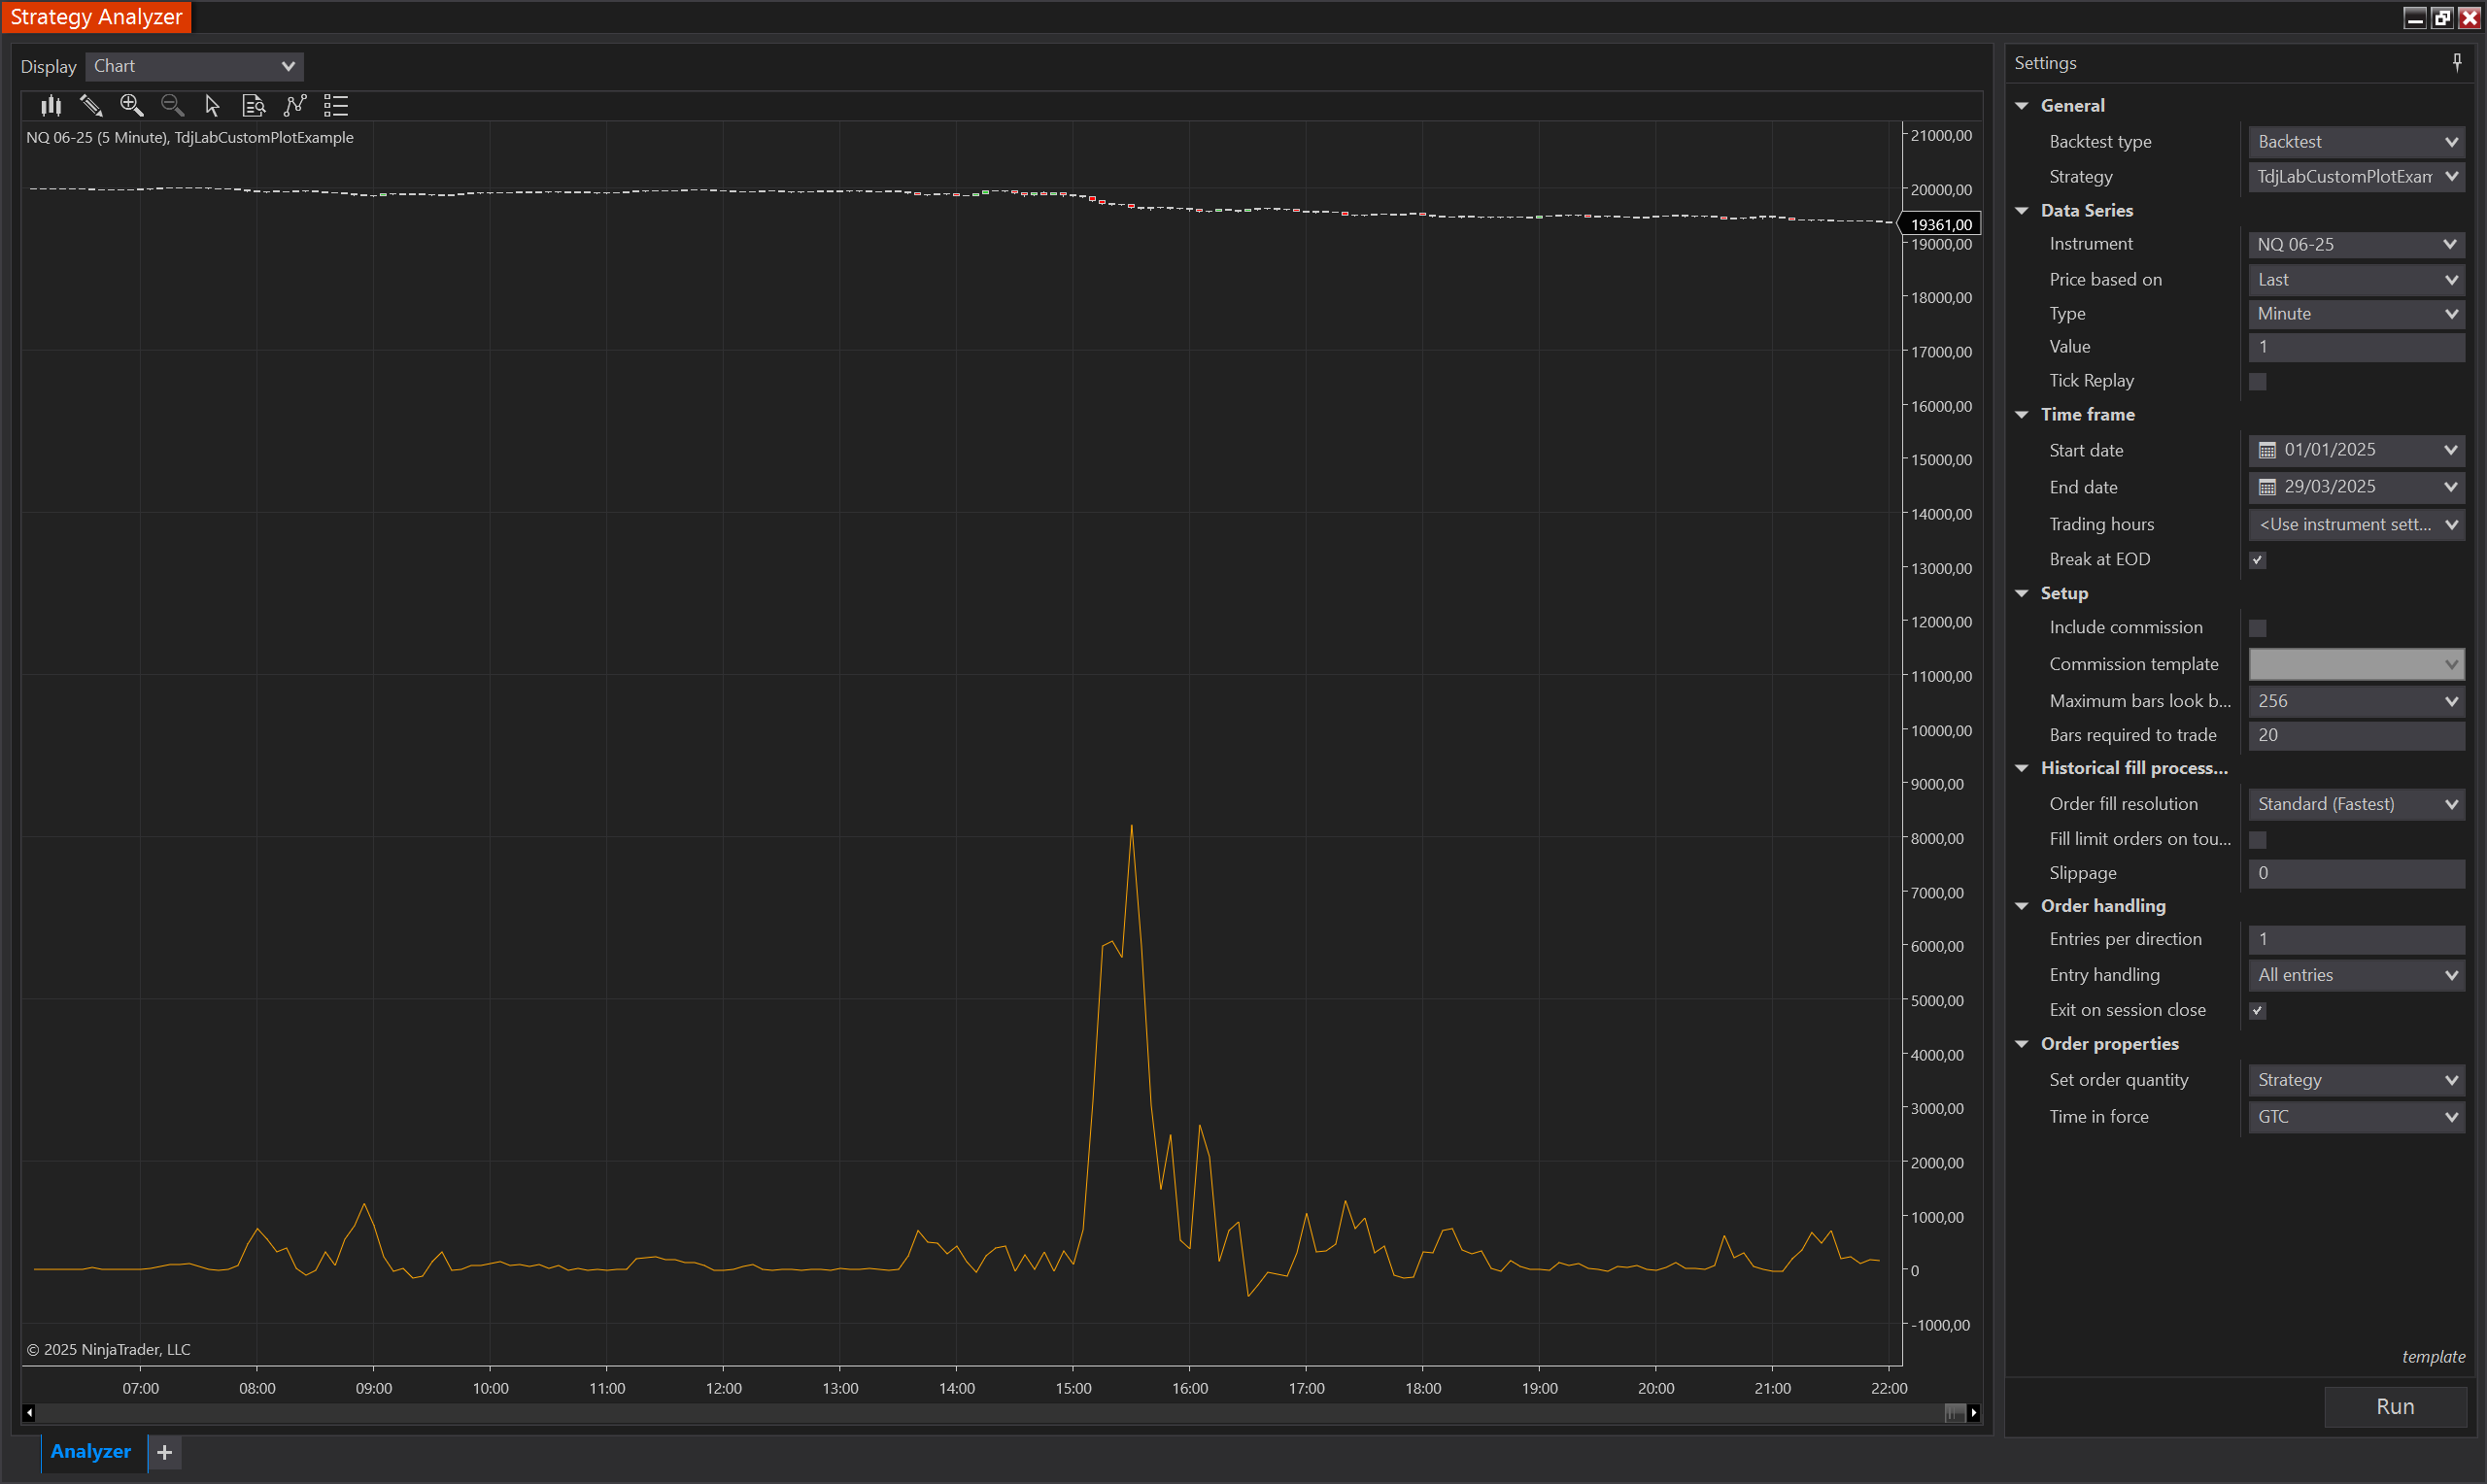
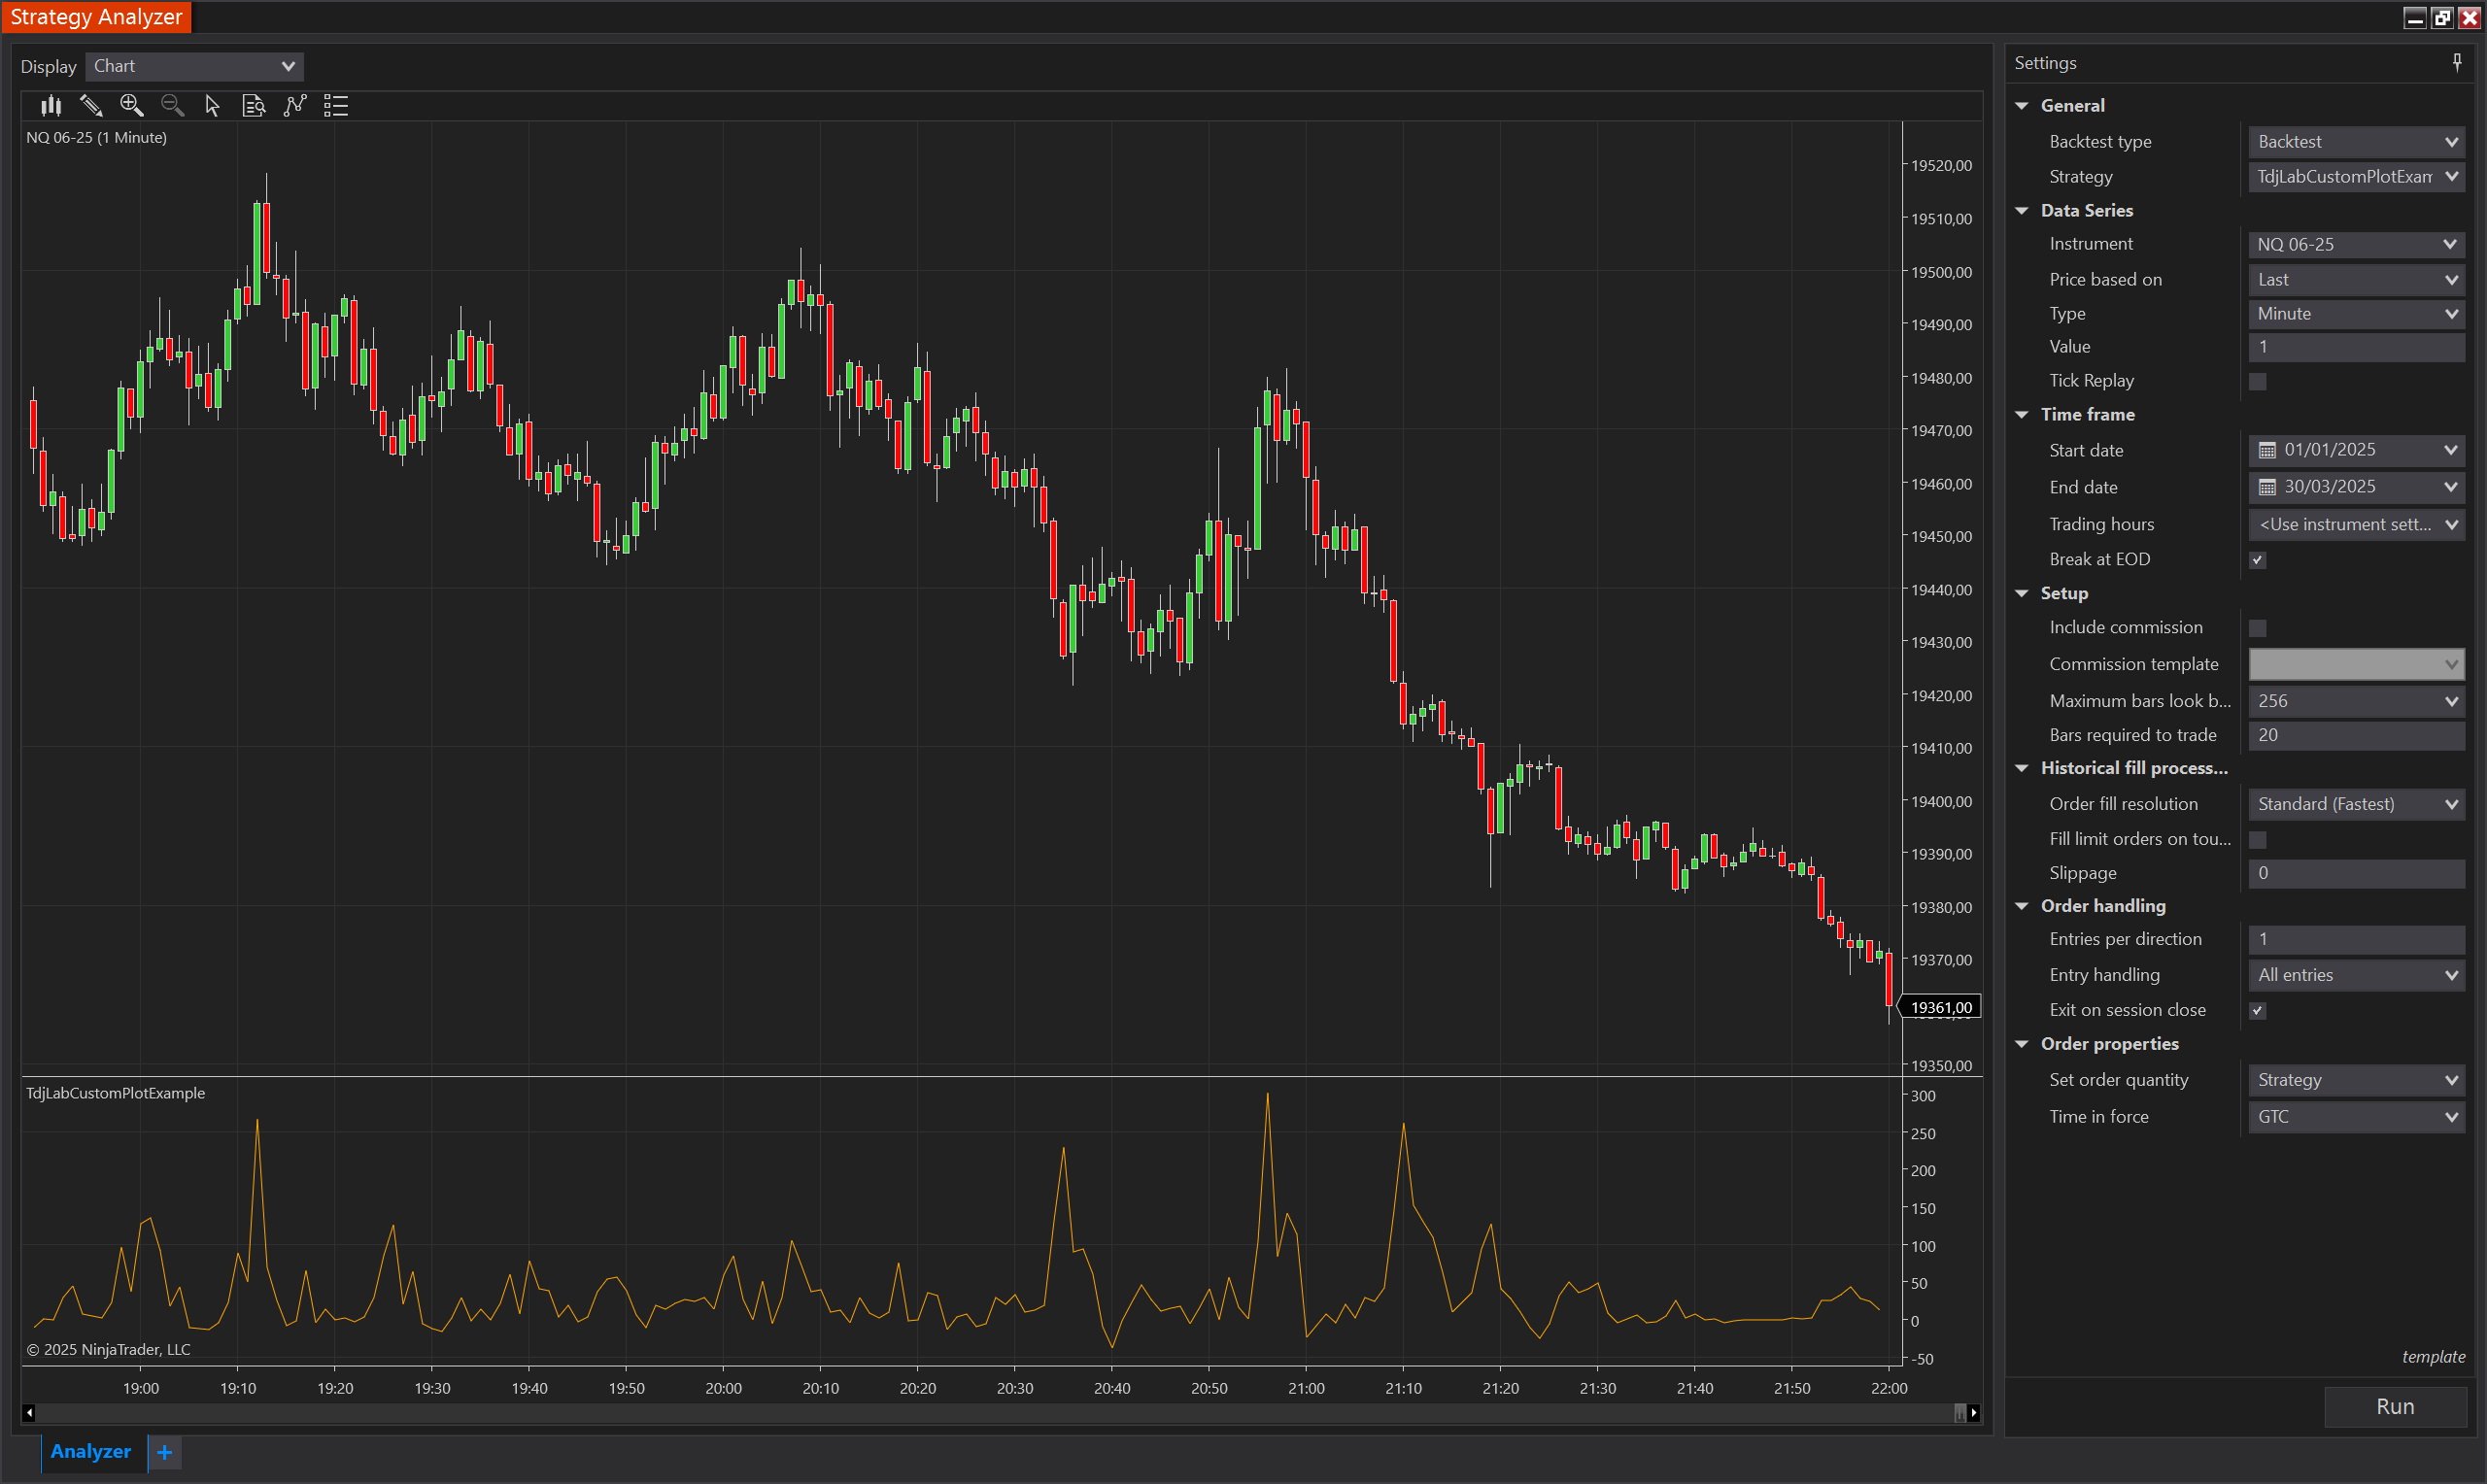
Step 4: See the Plot in Action
Once compiled and applied to a chart, your custom plot will display in the chart panel.
Use it during:
- Playback
- Live simulation
- Historical bar review
This lets you analyze and refine your strategy visually before using it in production.
Pro Tips
- Plotting in a Separate Panel: By default, strategy plots overlay the main price panel. To display your plot in a separate panel, set the
IsOverlayproperty tofalsewithin theState.SetDefaultssection of your strategy code:
if (State == State.SetDefaults)
{
    IsOverlay = false;
    AddPlot(Brushes.Orange, "MomentumBias");
}
This configuration ensures that the plot appears below the main price chart in its own panel.
- Using Custom Indicators for Enhanced Visualization: For more advanced visualization options, consider creating a custom indicator to perform your calculations and display plots. This approach offers greater flexibility and can be integrated into your strategy as needed.
- Use a
ShowPlotboolean input to toggle visibility during testing. - Keep your plotting logic separate from entry/exit logic for easier debugging.
- Color-code each plot to avoid confusion if you add more than one.
IsOverlay = false; setting, readers can effectively display strategy plots in separate panels, enhancing the clarity and usability of their NinjaTrader strategies.Conclusion
Adding a custom plot to your NinjaTrader strategy gives you insight into how your formulas behave in real time. Whether you're tuning a filter, debugging behavior, or training your eye — visualizing logic is a game-changer.
Need Help?
We build professional-grade custom indicators for NinjaTrader 8 — designed to help traders identify high-probability setups, manage risk, and gain clarity in live markets.
Browse the full collection at TradingDJ.com/ninjatrader-indicators.
If you're already using our indicators and want help combining them in a strategy or visualizing your logic — feel free to reach out. We’re happy to assist.